| Overview | Science | Project | Data | People | Publications | News |
The NEXRAD WSR-88D radar network operated by the National Oceanic and Atmospheric Administration (NOAA) in the United States provides thre-dimensional observations of storms at approximately 5-minute intervals from more than 150 individual radar locations. These three-dimensional radar observations are publicly available in real time and will be synthesized into a domain encompassing the Contiguous U.S. to support forecasting and flight planning during DCOTSS.
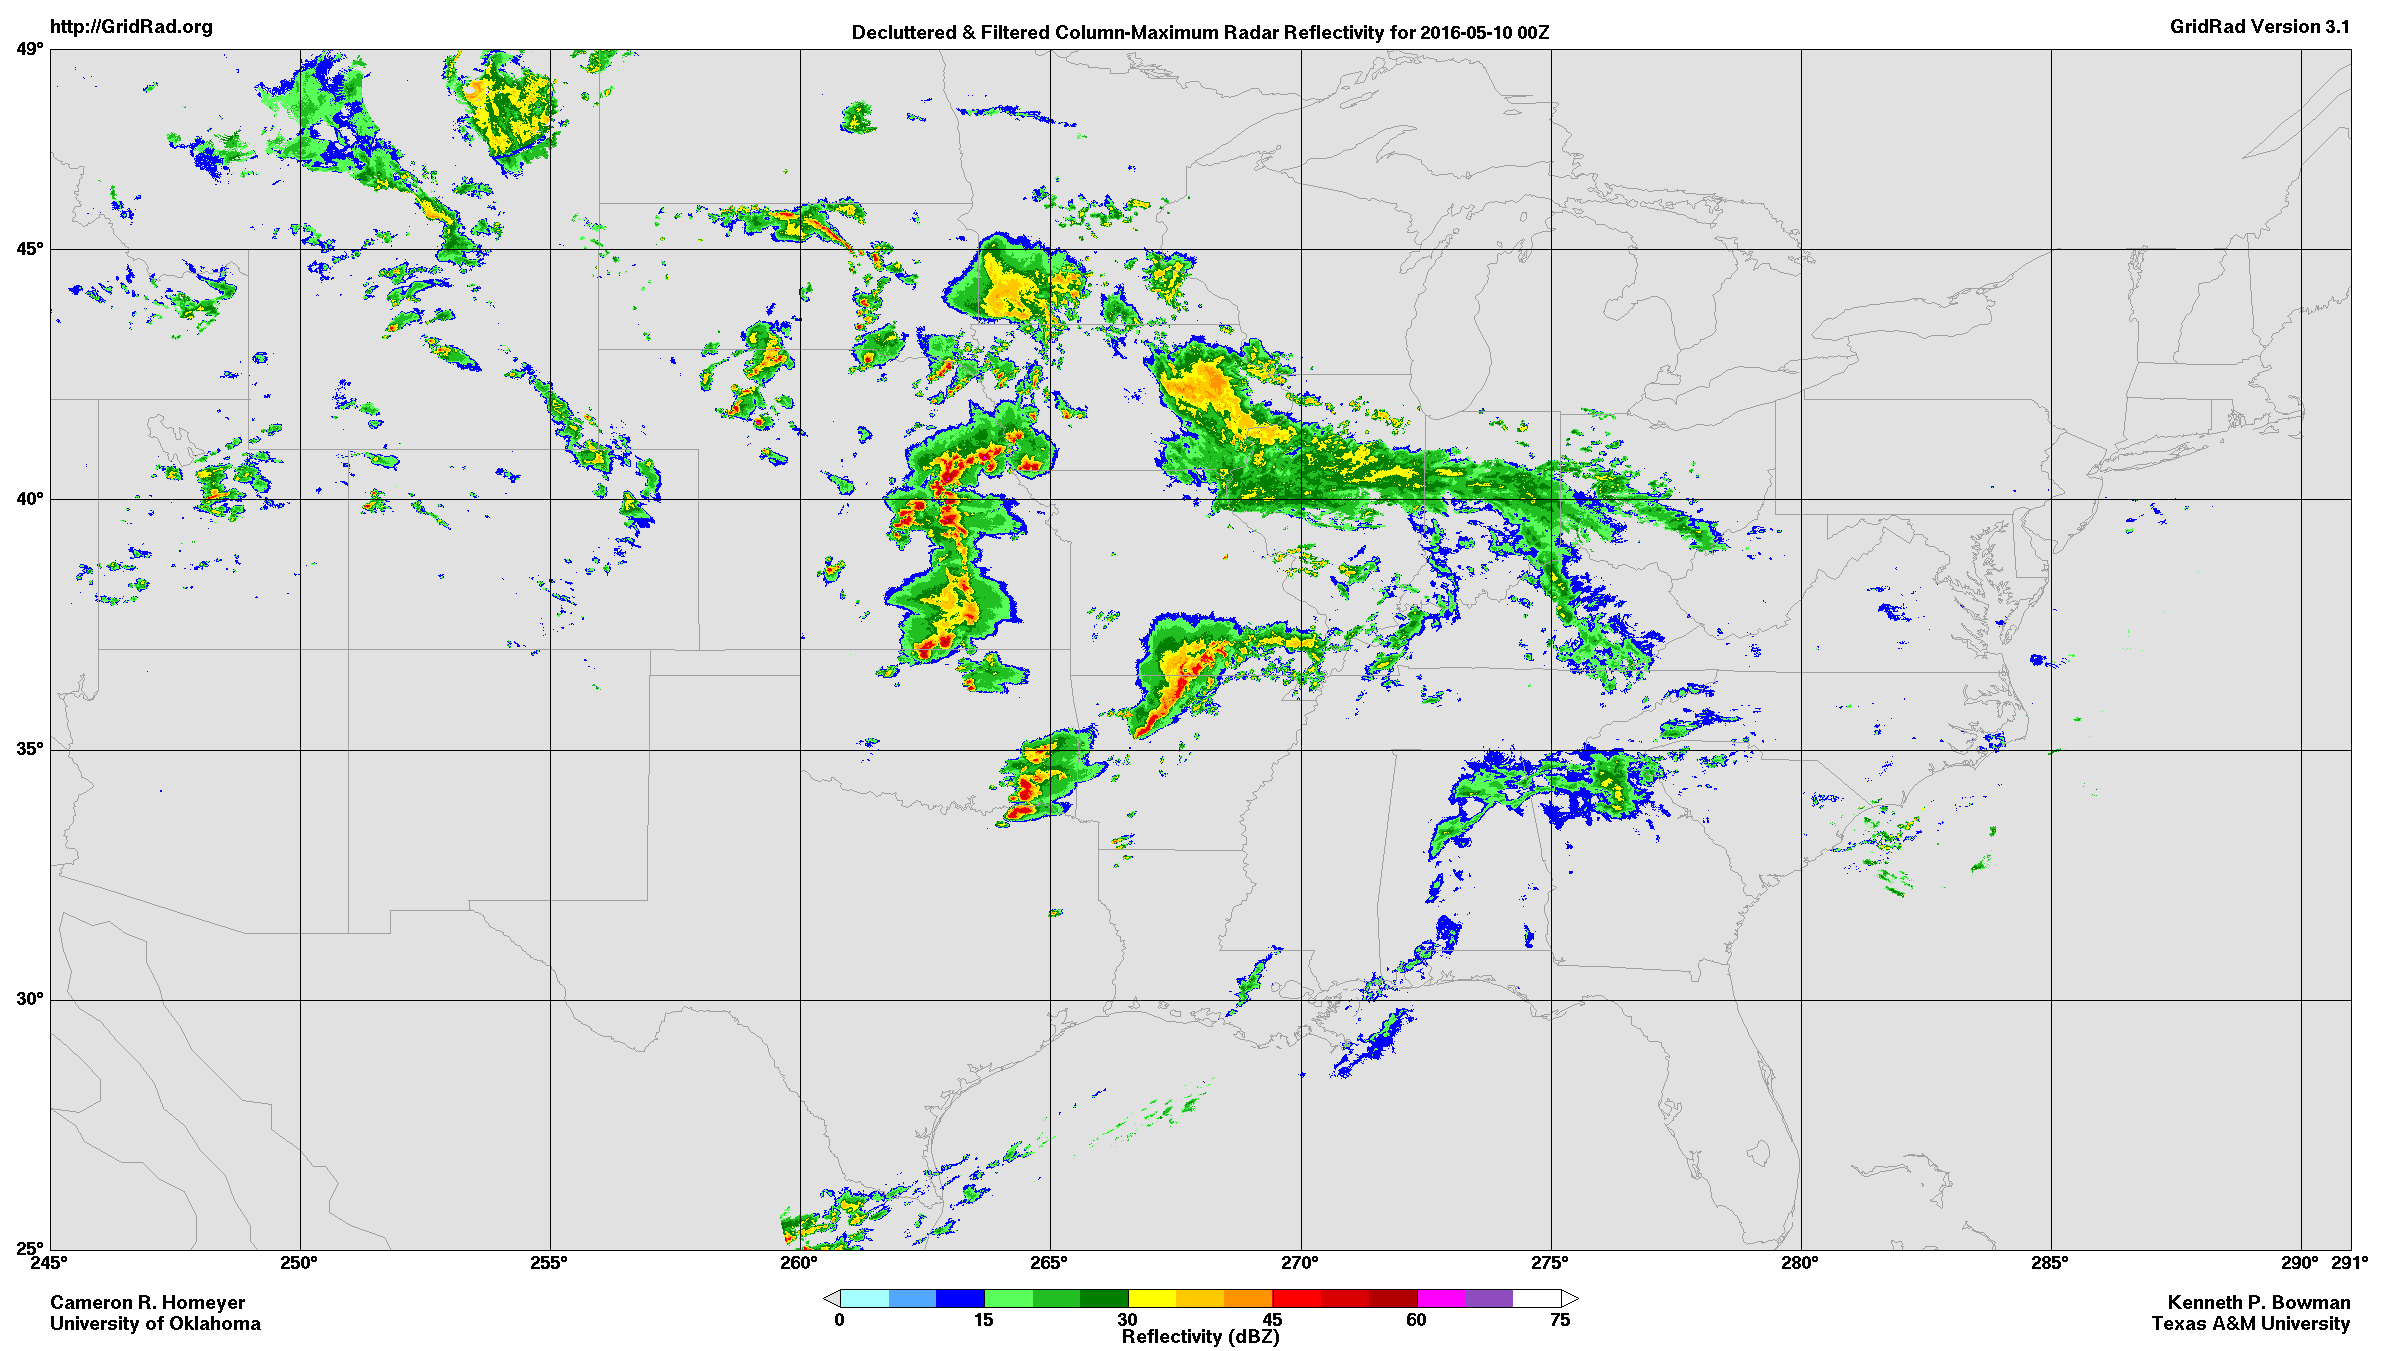
Cameron Homeyer's group at the University of Oklahoma will maintain a real-time implementation of the Gridded NEXRAD WSR-88D Radar (GridRad) dataset to enable identification of tropopause-overshooting convection within the NEXRAD network. An example is shown below.
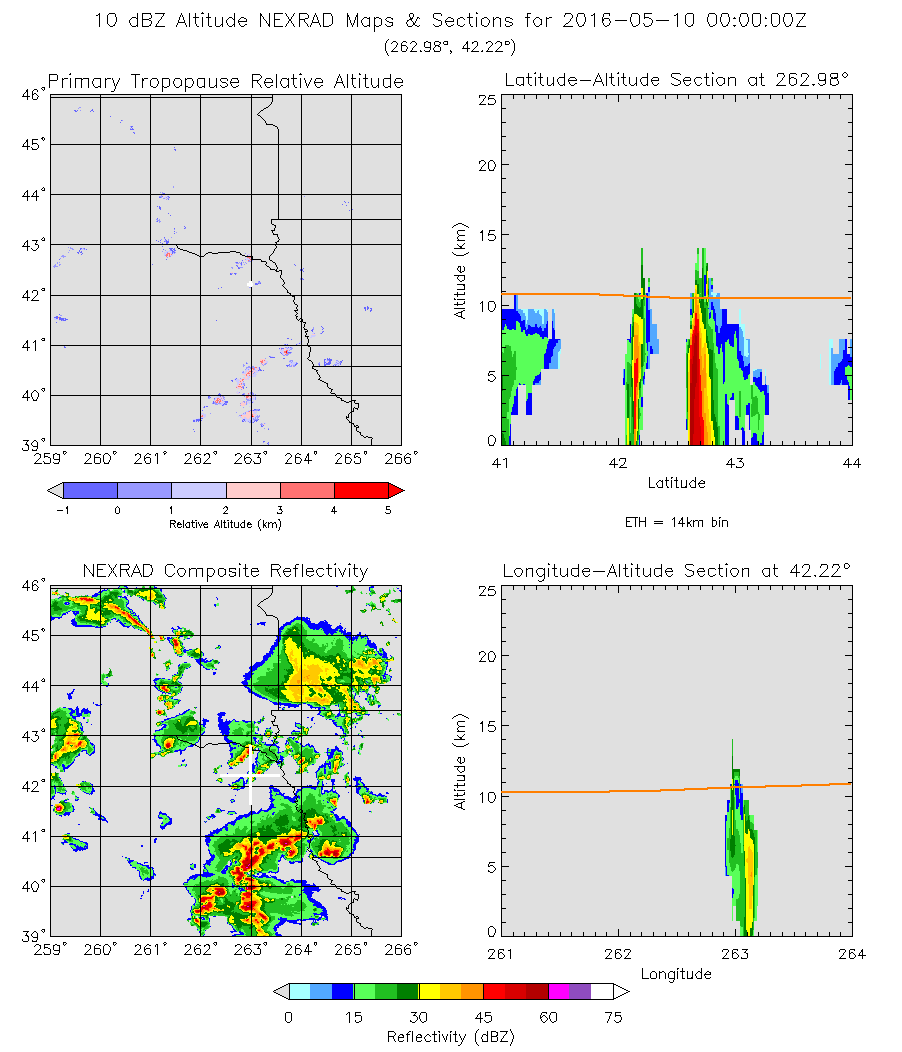
Air masses that have potentially been modified by these overshooting storms will be tracked via trajectory calculations initialized at the locations and altitudes of the identified overshoots. These trajectory forecasts will be used to plan the DCOTSS science flights.
GridRad was developed by DCOTSS investigators Homeyer and Bowman, who maintain a public long-term hourly archive of the data. More information on GridRad, including a description of the methods used for merging individual radars and access to data and software, can be found at http://gridrad.org.